Data Tools
Simplify the comparison of measurement data with simulation results or other logger data. Access data from pdf documents and images.

SmartCAE Data Tools
... lets you digitize, compare, and process your data. Use the Data Tools to compare simulation results from SmartCAE Thermal Packaging to climate chamber tests, process your logger data, or use them to revive "dead" data from images and pdf documents.
Whatever your use case, with our Data Tools you will add a smart extra to your software toolbox, as standalone or together with our other modules. A great productivity booster for anyone working with data comparison and accessibility.
Benefits:
-
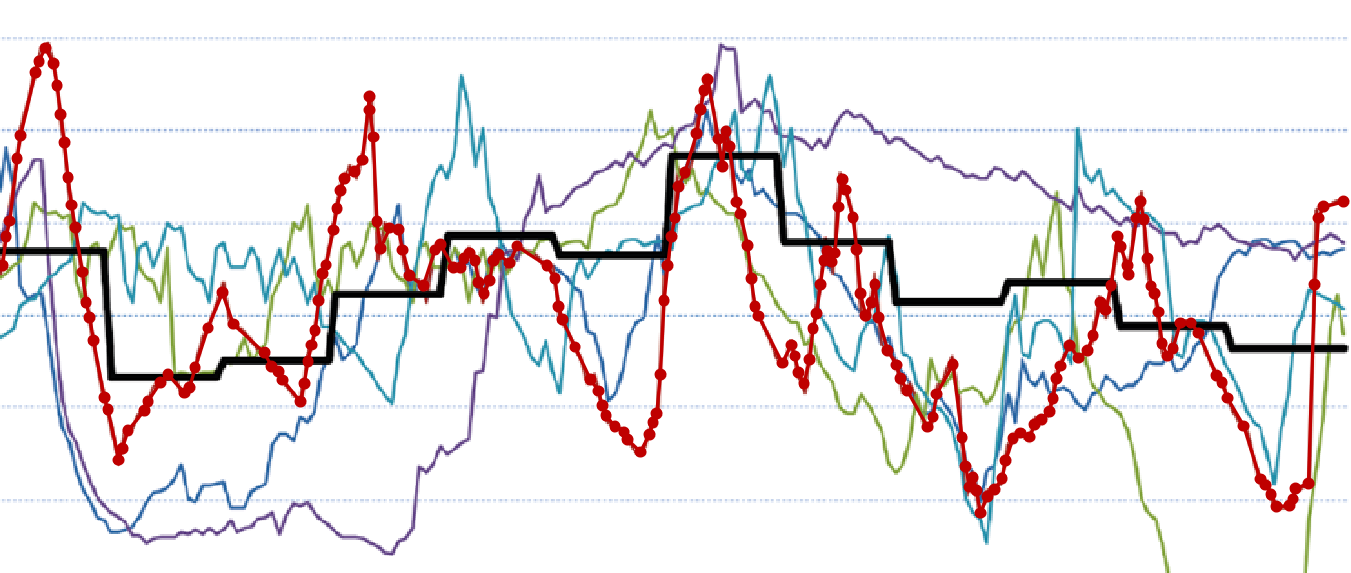
Overlay measurement data with simulation results from your SmartCAE Thermal Packaging.
-
Compare triple tests from climate chamber tests and see how much they differ.
-
Digitize Ambient Temperature Profiles (ATP) from qualification report pdfs and use them as ATPs in your simulation.
-
Check out the statistics of any given profile and determine Kelvin hours, minimum/maximum temperatures or correlation coefficients between two profiles.
How it works

Access Data
We know how frustrating it is to have data trapped within a pdf document. This is why we invented the module Digitize Line.
Load an image, tell the program what line color you are looking for, and it will detect your data curve. Export the datapoints to an Excel format, or import it directly as an ambient temperature profile for your SmartCAE Thermal Packaging. Easy access guaranteed.

Analyze Data
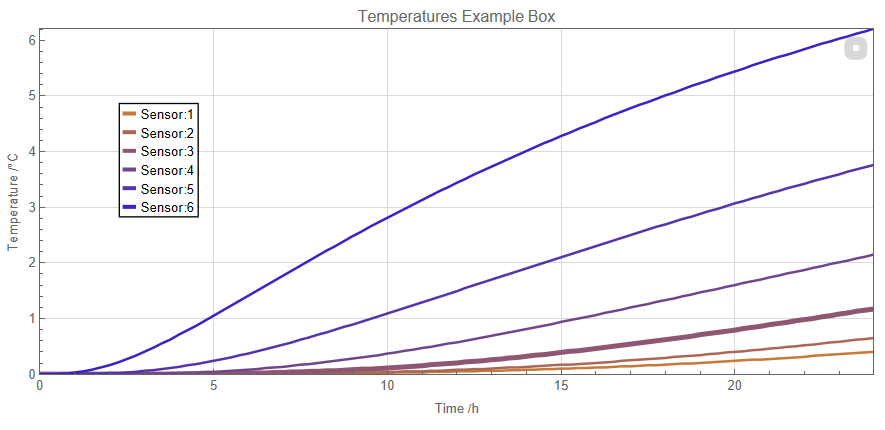
With the module Compare Profiles, you can load several data profiles — such as temperature profiles, logger data, or simulation results — and compare the curves. For example, to compare measurements to simulations.
In Compare Profiles, you then have the option to run statistics on your data and analyze key characteristics, such as Kelvin hours, temperature minima and maxima, etc. You can also add legends and adjust the plot appearance. This way, you can directly copy your desired comparison plot into a presentation, or share it with your colleagues.

Process Data
Do you want to run comparisons between measurements, and your data is given in different time steps? Are you using a given temperature profile for your SmartCAE Thermal Packaging, and running the simulation is taking longer than usual?
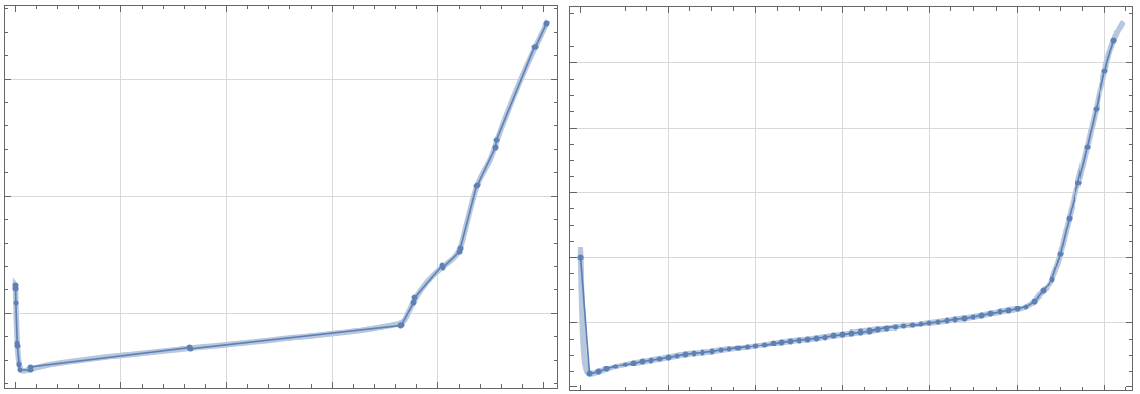
With the module Resample Data you can recalculate datapoints to match your use case. Optimize the number for of datapoints for an ambient temperature profile to speed up the simulation by using the linearization approach. Or, take the equidistant approach and set new timesteps.
Related software modules
The SmartCAE Data Tools is one of our basic software module packages. They are usable as standalone, or as an addition to other modules. Check them out below:
Get your free trial today.
Click on the link below to unlock your 30 days free trial version.